I was attracted to surfing since a while; I had a classic start by taking beginner lessons on one of the crowded Portuguese beaches. I got a new job and moved to Norway, at first worried about cold water, but after a visit to Stavanger, my hopes grew. A new job and new life in Oslo basically made driving 1.5 – 2 hours each way to surf beach not realistic. In 2020 the corona epidemic broke up, and we were all told to work from home which meant my working hours and what I would call “office” were much more flexible. Unlike gyms beaches in Norway were still open.
Oslo is not the best place to start, the internet and YouTube became my ” surf school”. Learning how to pop up was much less of a problem in comparison – to “but when will there be good waves?”
One of the channels The Surf Rat was particularly inspirational. Tom was explaining that with the progress of civilization we lost our ancestor’s skill of reading the weather. As a new generation, we ended up with ready-made forecasts, so processed that it did not longer resemble the origin. He compared it to a chicken nugget that no longer resembles the flesh of a chicken. Similarly, people relying only on forecasts app gave up on observation skills and lost knowledge to understand natural phenomena. I got intrigued and decided to learn more.
The wave story that you have most likely seen:
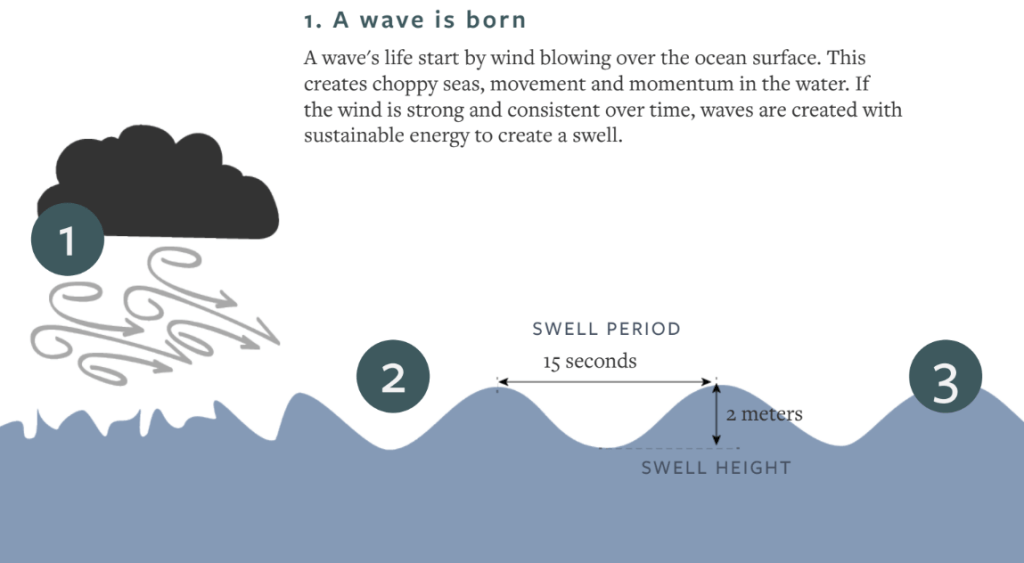
The simplified story, presented in almost every surfer magazine is that somewhere in the ocean a big storm happened, and strong winds created the “fetch area” in which waves were born. Waves then traveled long distances to the shore, depending on the more or less scientific versions of the story they would group and order – creating sets, and then, when they will finally reach the shores, they would start to grow in the shallow water to break in the surf zone. The moment just before the breakup is the 5 minutes of the joy of a surfer. The story also mentioned sometimes that the waves can be “measured” by somehow mysterious “wave buoys” located somewhere out in the water, and based on those measurements the forecast is made. Back then I knew nothing about turbulence, local storms, island, or currents that can make the whole story so much complicated, blissful ignorance can be helpful at the beginning.
I read some articles and even did some training on “how to read surf forecast”, just to conclude that most people do not even know how to read it. Equipped with my new knowledge, together with a newly bought hard surfboard (I did not yet know the board is way too heavy to start) I decided to give it a go and I started showing up at the local beach, making observations.
I would take a print screen of the forecast, a photo of waves, check the wind, and sadly conclude there was not much correlation. I asked around – some people would check DMI (Danish forecast), but that was basically it. Obviously, something was wrong with the forecast. Ok “where are those wave buoys” I started to wonder. There must be some way to get the data and check how is that possible.
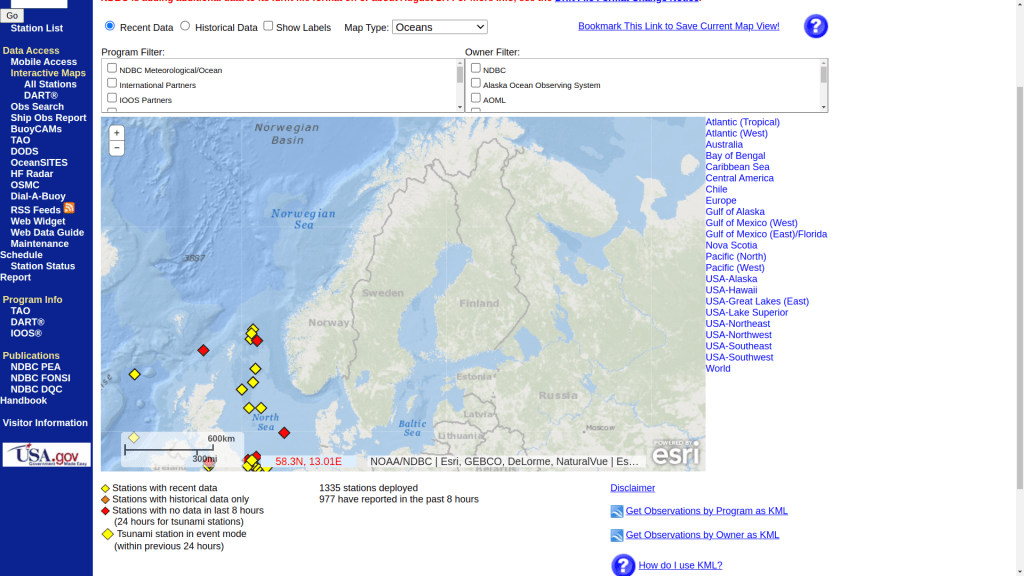

After heavy googling, it turned out that there are not many, for sure no wave buoys close to my surfing beach, and very few in the Norwegian Sea. In addition, most of the wave boys were located close to … oil platforms … not surf beaches. There was another issue- many of those wave buoys were simply “too close” to rely only on this information to forecast. The time between passing the boy and reaching the shore was simply too short to make a useful forecast – few people would be interested in a forecast 1 hour ahead. If so how can the whole forecast even be done? I realized there must be something more to the forecast than the common surfer wisdom about marine wave buoys. I started to dig deeper (read google) and I discovered Copernicus Maritime and MetEd, then I discovered that global forecasts exist, that the data is publicly available and that surfing forecast webpages is basically wrappers for that data.
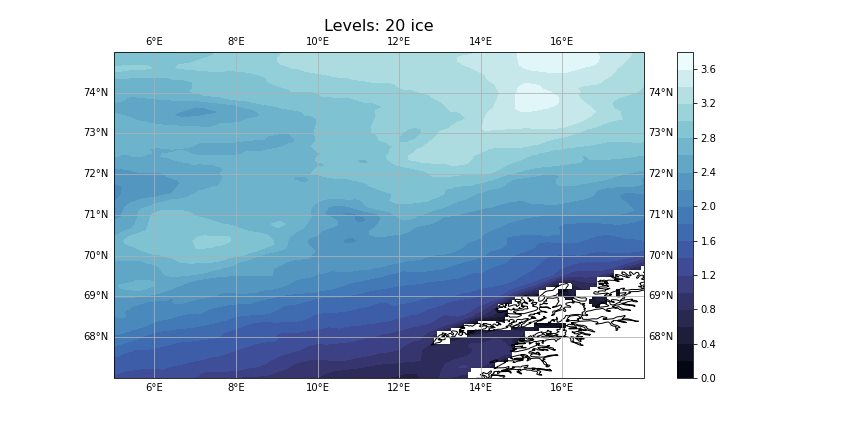
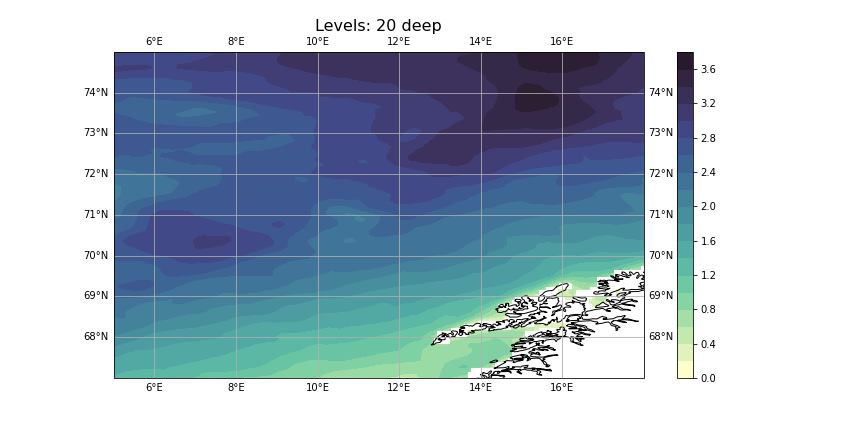
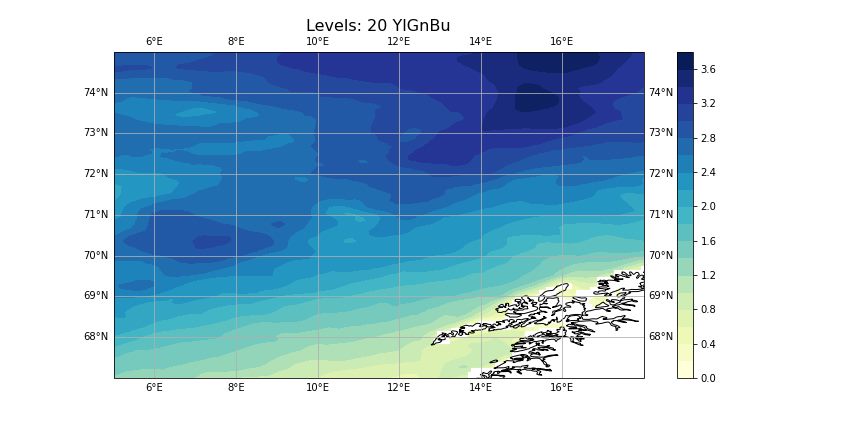
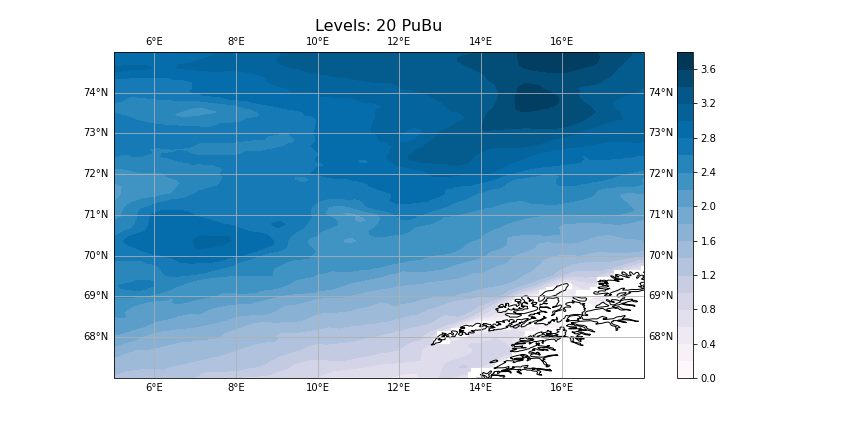
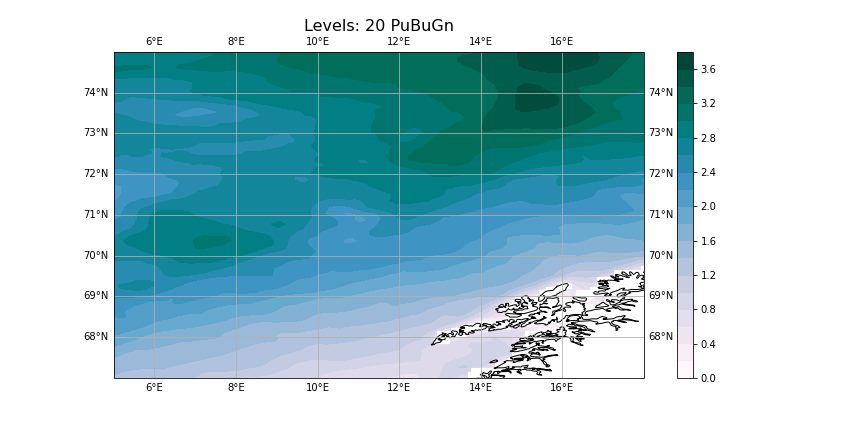
tutaj add pohtos of generated forecast
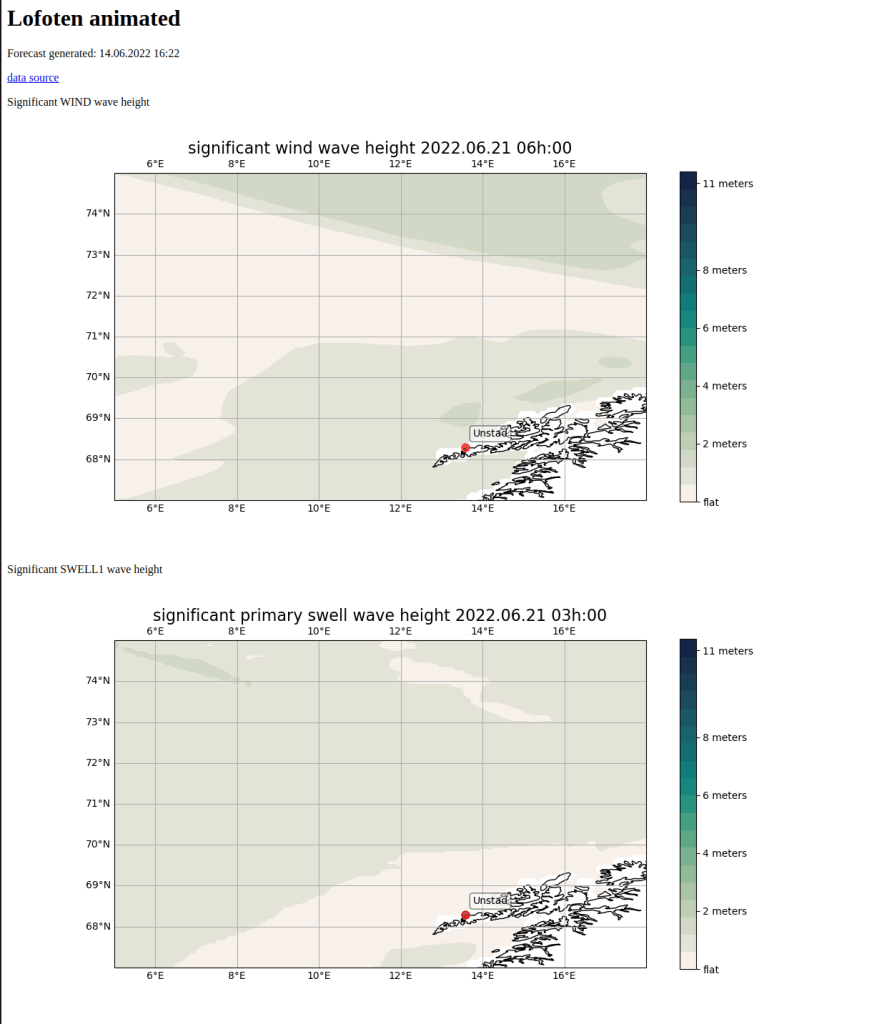
ing NOAA data and using Cartopy library

Leave a comment